
How to Look Up Mercer County Jail Population Data
Jail population data lives in several places, and no single county dashboard publishes a daily count in the public pages reviewed here. The county Corrections page provides the facility's bed capacity and a description of who it holds. For counts and trends, research bodies are the better source. The Bureau of Justice Statistics publishes national and state jail data, the Vera Institute tracks incarceration trends by county, and the Prison Policy Initiative profiles each state. These are the right starting points when you want numbers rather than a name search.
This page stays focused on population data, not on locating one person. To find a specific inmate by name, the county jail and the state offender search are the correct tools, and those are covered on the inmate records page. Use the sources here for context, capacity, and how the population breaks down.
Mercer County Jail Capacity Overview
The hard local number is capacity. The official Mercer County Corrections page states the Correction Center has bed space for 871 inmates. It is a short-term jail for men and women, with minimum, medium, and maximum security classifications. Capacity is not the same as the number of people held on a given day, so treat 871 as the design figure rather than a live count.
| Facility | Capacity | Population Groups Held |
|---|---|---|
| Mercer County Correction Center | 871 beds | Pretrial detainees, municipal and Superior Court sentenced, state-transfer holds, sentences up to 364 days |
The facility sits at 1750 River Road on Route 29 North in Hopewell Township, with mail handled through the county Trenton address.
Average Daily Population
Average daily population, or ADP, is the typical number of people held across a period. The county's public Corrections pages reviewed here did not publish a current ADP, an annual booking count, or a cost-per-inmate figure. Rather than invent one, the honest approach is to label ADP as a research gap and point to sources that estimate jail populations. County budgets, annual reports, and open-records responses can also yield ADP if you request them.
If you need a verified ADP, an Open Public Records Act request to the county can ask for it directly. Outside research bodies estimate jail populations on a delay, so their figures are useful for context but may lag the present day. ADP also moves with the seasons and with policy changes, so a single figure is only a snapshot. New Jersey's shift away from cash bail changed how many people are held before trial, which in turn affects ADP at county jails statewide. When you read any population number, note the date it covers and the source, because a figure from two years ago may not match today.
Demographic Breakdown
A demographic breakdown shows the population by race, sex, and age. The county pages reviewed did not publish a current Mercer breakdown, so specific local percentages are a research gap. For context on how New Jersey jail and prison populations break down, the Prison Policy Initiative state profile is a useful, sourced overview. Treat any state-level breakdown as context, not as a precise Mercer County count.
The state profile is the Prison Policy Initiative New Jersey profile.
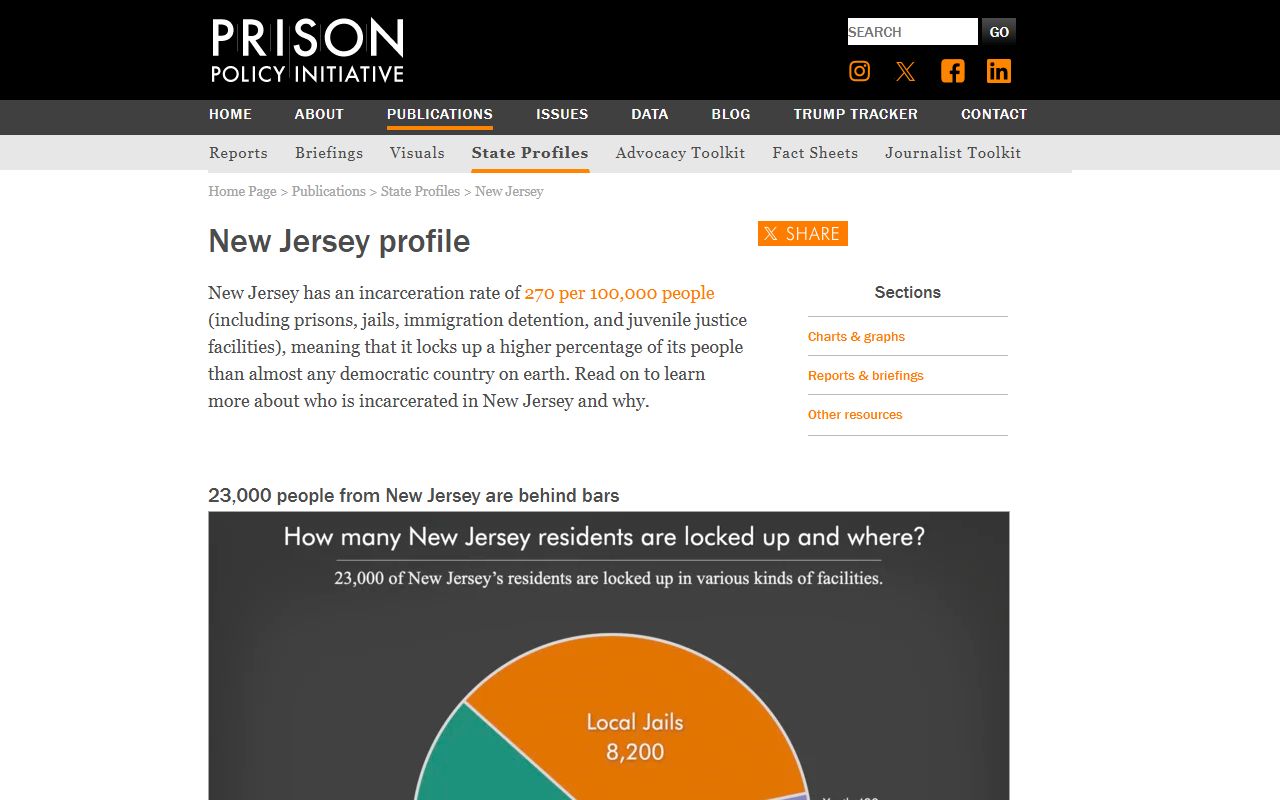
The profile presents statewide figures and disparities. It helps frame what a county jail population may look like, while leaving the exact Mercer numbers to county data and records requests.
Pretrial vs Sentenced Population
The Correction Center holds two broad groups. Pretrial detainees are awaiting case outcomes and have not been sentenced. Sentenced people are serving terms imposed by a Municipal or Superior Court, generally up to 364 days, or are waiting to transfer to state prison. The exact split changes constantly as cases resolve. New Jersey's move away from cash bail shifted many release decisions toward pretrial services and detention motions, which affects who stays in jail before trial.
| Group | Description |
|---|---|
| Pretrial detainees | Held while a case is pending, not yet sentenced. |
| Municipal or Superior Court sentenced | Serving a term, generally up to 364 days. |
| State-transfer holds | Sentenced to state prison and awaiting transfer. |
Because the jail is short-term, the sentenced group skews toward shorter terms, while longer sentences move on to the state system. The pretrial share is sensitive to court scheduling and release decisions, so it can rise when cases back up and fall when courts move faster. This is why two snapshots months apart can look quite different even at the same facility. For a person tracking one case, the docket shows whether someone is held pretrial or has been sentenced, which the population data alone cannot tell you.
Misdemeanor vs Felony Population
New Jersey does not use the words misdemeanor and felony the way some states do. It grades offenses as disorderly persons offenses, handled in municipal court, and indictable crimes, handled in the Superior Court by degree. A county jail population includes people tied to both tracks, from those serving short municipal sentences to those held pretrial on serious indictable charges. The grading affects where a case is heard and the possible penalty, which in turn affects who is held and for how long. Because the most serious cases carry the longest possible terms, those defendants are more likely to be held pretrial, while lower-level matters more often end in release or a short sentence.
Mental Health and Medical Population
The county states that inmates receive medical, social, mental health, and educational services while held. A share of any jail population needs medical or mental health care, and the facility provides these services on site. Specific counts of inmates receiving mental health or medical care were not published in the county pages reviewed, so a precise local figure is a research gap. For people facing civil commitment, the state public defender provides mental health advocacy, which is separate from county jail care. Jails nationally hold a meaningful share of people with mental health and substance-use needs, which is part of why New Jersey runs Recovery Court for eligible defendants whose offenses tie to addiction. That program can divert some people from custody into treatment, which over time affects who remains in the jail population.
National and State Context
To compare Mercer with broader trends, national and state research is the right source. The Bureau of Justice Statistics publishes jail inmate reports that set the national picture, including population counts and rates per 100,000 residents. These reports help you see whether a county sits above or below typical levels, though they do not replace a verified local count.
The national source is the Bureau of Justice Statistics.

BJS data is national and state in scope. The table below shows where each level of rate data comes from and how to read it for Mercer County.
| Level | Rate per 100,000 | Source |
|---|---|---|
| Mercer County | Not published in county pages | County budget or OPRA request |
| New Jersey | State context available | Prison Policy Initiative, Vera Institute |
| National | National context available | Bureau of Justice Statistics |
The Vera Institute Incarceration Trends project also tracks county-level jail data over time and is worth checking alongside BJS. Reading the three levels together gives the best picture. A national rate sets a baseline, a state figure shows where New Jersey sits, and a county number, when you can get one, shows how Mercer compares. Because the county rate is not published in the pages reviewed here, the honest move is to use the state and national context and to mark the county figure as something you would request rather than assume.
Population Trends Over Time
No official Mercer County five-year jail trend table was found in the county sources reviewed. In general, many county jails saw pandemic-era population drops around 2020, followed by partial rebounds, but any Mercer-specific claim must rest on a county report, a BJS or Vera county series, or data produced through an open-records request. The safest local anchor remains the verified 871-bed capacity, with population totals treated as estimates until confirmed. A trend line built from mixed or undated sources can mislead, so it is better to cite one consistent series than to stitch together numbers that measure different things.
Note: Treat 871 as verified capacity, not a live headcount; population totals should be confirmed through county data or an open-records request.
Searching for Mercer County Inmate Records by Name
This page covers population data, not individual lookups. To find a specific person, use the county jail and the state offender systems. A name search for current custody goes through the Correction Center and the New Jersey court tools, and state prison custody goes through NJDOC. Those steps are covered in full on the Mercer County inmate records page.
Where the Data Comes From
Capacity comes straight from the county Corrections page. Population estimates and rates come from the Bureau of Justice Statistics, the Vera Institute, and the Prison Policy Initiative. Verified local counts, when needed, come from county budgets, annual reports, or an Open Public Records Act request. Keeping these sources separate is what keeps the numbers honest, since a national estimate is not the same as a same-day Mercer headcount.
For how to file an open-records request for county data, see the Mercer County public records page. When you request jail data, ask for a specific date range and the exact measure you want, such as average daily population or bookings per year, since a vague request is harder for the custodian to fill. Being precise also makes the response easier to compare against state and national figures.